ABSTRACT
The New York City Department of Health and Mental Hygiene (DOHMH) executes unannounced inspections on restaurants in the New York City area and utilized a letter grading system to evaluate the result. In order determine whether bias is included in this system, the author adopted the DOHMH Restaurant Inspection Result data and analyzed the visualization results and the precision rate of the decision tree trained by a specific cuisine type from the dataset. The result is suggesting that bias might exists in the inspection system but further research is needed to prove this observation. The author also suggests that although the inspection system can still function with the existence of bias, the reduce of biases can help DOHMH understand the sanitary situation better in an overall perspective.
This research was conducted as a school work during my study at Pratt Institute when taking the Data Analytics course with Dr. Michelle McSweeney.
INTRODUCTION
After I received an offer from a university in the United States, many of my friends and relatives were worrying whether I can find good restaurants here – there is a terrible stereotype in China that people can hardly find good Chinese food here in the United States – even though Chinese restaurants might have virally spread among this country. The rumor is partially true. While I traveled across the continent, I met many Chinese restaurants but only a few of them are providing authentic Chinese food. However, if you narrowed down the scope to the New York City, the concept became totally fake. Like any other aspects of New York, the food culture here is also a great “melting pot”. In the Department of Health and Mental Hygiene (DOHMH) Restaurant Inspection data (Appendix 1), 85 different cuisine type was documented, Asian food, European food, you can basically find any kind of food that you can think of. And this record does met my experience in New York, that no one should ever worry about that their appetite can not be satisfied in New York.
Since the taste won’t be a problem, people might worry whether the food is safe enough. In order to satisfy this, the DOHMH of New York City utilizes a restaurant letter grading system to determine their sanitary condition, and run unannounced inspections on restaurants frequently and update their scores and grades. This dynamic and unannounced process forced each restaurant cares about their hygiene condition, and as a result, increased the food sanitary condition in the whole city. In a former research, researchers has proved that this system is effective and is actually helping in the improvement of the city’s restaurant sanitary conditions, and indicated that the program is an “effective regulatory tool” (Wong, et al.). However, every system running by humans has a bias. Especially in a melting pot of people from different background like New York, it worth more concern about biases.
More than once I’ve seen or heard comments like “China Town service” or “dirty Latino diner”, but I doubt anyone has ever heard a French restaurant being commented “terrible sanitary condition”. Admittedly (and unfortunately), finding a dirty Latino diner or a terribly serving Chinese restaurant is much easier than finding a terrible French restaurant (for complicated reasons). However, this can not be a reason for people to justify a whole kind of cuisine. Luckily, DOHMH Restaurant Inspection dataset provide a great window for people to take a peek into the performance of restaurants across cuisine types in compliance with city and state food safety regulation rules. What’s more, it would be also valuable to see whether DOHMH itself has any biases when grading and scoring restaurants. In this research, I analyzed the DOHMH Restaurant Inspection Data (Feb 16, 2019 version) to answer these questions, and check that whether some cuisine type is reportedly cleaner/dirtier than other cuisine types, and whether the DOHMH restaurant inspection is integrated and has no biases.
METHOD
The New York City Department of Health and Mental Hygiene (DOHMH) inspects restaurants frequently and updates the DOHMH Restaurant Inspection data everyday. This dataset is publicized on the NYC OpenData website, as well as the DOHMH’s Grading website. This dataset includes 18 variable. 8 variables of them provide the general information of each restaurant, including the CAMIS code (a unique 10-digits code determines the entity/restaurant) and the restaurants’ name (DBA), phone number (PHONE), address (BORO, BUILDING, STREET, and ZIPCODE), and cuisine type (CUISINE DESCRIPTION). 10 other variables record the details of each inspection, including the inspection dates (INSPECTION DATE), violation codes (VIOLATION CODE), scores (SCORE), grades (GRADE), criticalness (CRITICAL FLAG), and other inspection related information (ACTION, VIOLATION DESCRIPTION, GRADE DATE, RECORD DATE, INSPECTION TYPE).
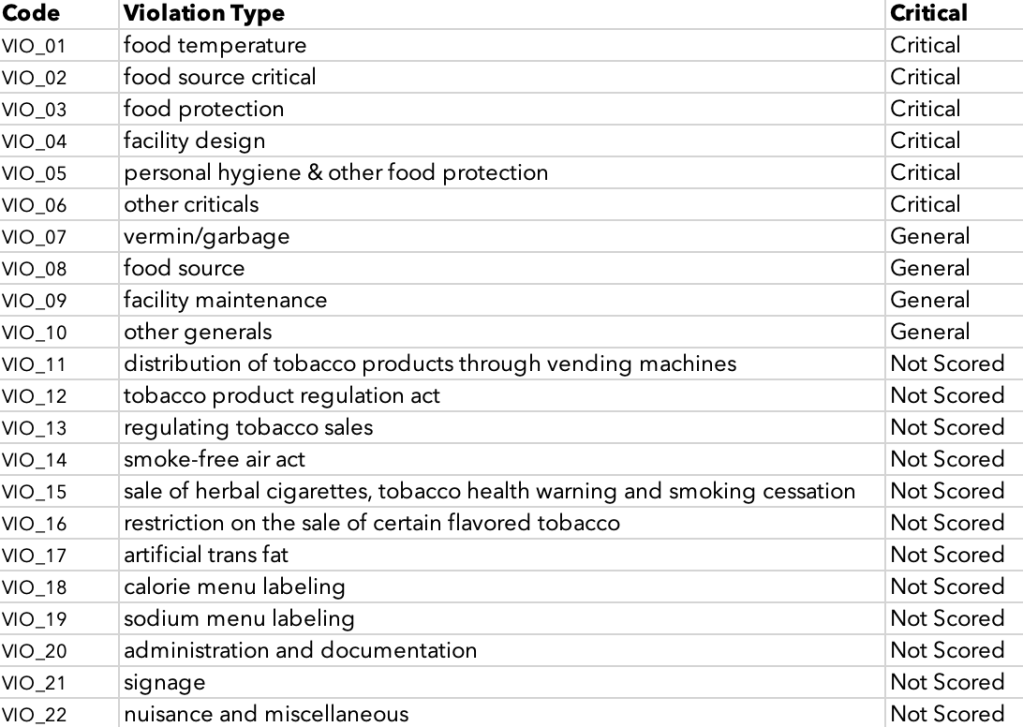
In this research, I focused on the restaurants’ cuisine types, and the inspection parameters including violation codes, scores and grades, and I took the borough and the inspection dates information as reference. (see fig.1) It is worth explaining here that the violation codes, scores and grades are correlated factors in the restaurant inspection system. The DOHMH utilized a scoring parameter system of violation codes (see Appendix 5) to indicate the violations of city and state food regulation rules that are found in inspections. These violation codes have been categorized into three groups to determine their critical value (critical, general and un-scored), and some of the critical violations are flagged with “Public Health Hazards (PHH)” (see appendix 6). DOHMH provides a detailed scoring method based on the conditions of these violations (see Appendix 4 & 5), and the accumulated scores of these violations will determine the restaurants’ letter grade (A, B, C, P and Z). According to DOHMH, means the restaurant got 0-14 points, grade B means 14-27 points, and grade C means 28 or more points. Grade P and Z indicates grade pending, which is either the restaurant is new or just reopened, or the sanitary condition is considerably bad so that the DOHMH had to close the restaurant and reorganize for further inspection.
In this research, I utilized the version retrieved on February 19th, 2019, from NYC OpenData. There are 386,187 rows in this version of the dataset covers inspection results on 27030 restaurants from 2012 to February 2019. Each row represents one citation, which is one violation detected in one inspection at one restaurant. Before I started the analysis, I manipulated the dataset several times to make it more meaningful in showing the trend of DOHMH grading across different cuisine types.
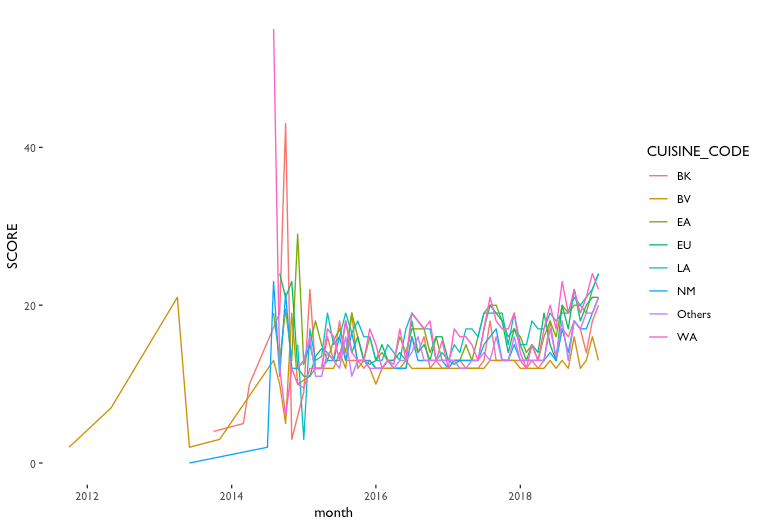
The first thing I did was to filter the data by time. I used only the records after May 2015, for the reasons that the data is made public after that and the data before is not reliable. As it can be observed from fig.2, the monthly average score before 2015 is zigged and unstable, which might due to incomplete record, or the grading/scoring principles has varied. It is worth mentioning that there are several observations have their observation were marked 1900-01-01, which means these restaurants are new and have never been inspected, according to DOHMH’s “About Restaurant Inspection Data” document (Appendix 2), have been filter out as well.
The second thing I did was to create grouping columns. In the DOHMH scoring parameter system, there are more than a hundred of unique violation codes. In order to make more meaningful observations, I introduced two grouping columns for the violation code, both are based on the DOHMH’s own system. One is grouping by critical type (see appendix 6, FOOD SERVICE ESTABLISHMENT AND NON RETAIL FOOD SERVICE ESTABLISHMENT PENALTY SCHEDULE), which helps the observers to understand the portion of each critical type were recorded across cuisine types. There are four levels of criticalness, public health hazard, critical, general, and un-scored violations (in many other documents of DOHMH, public health hazard is usually a subset of critical violations, but it would be more meaningful if it’s a separated categorize). I used this column to replace the original “CRITICAL FLAG” column which missed the public health hazard and non-scored violation information. To include this data, I created a table based on the Appendix 6, and merged it with the main DOHMH dataset. Another grouping is violation type. DOHMH determined their violation code with a number and a letter. The number indicated the violation type. This category can be seen in DOHMH’s SELF-INSPECTION WORKSHEET for FOOD SERVICE ESTABLISHMENTS (Appendix 4). In order to append the “violation type” information to the dataset, I used regular expressions to find the observations with specific violation codes and assign the violation type value to that row. Since there are two “food source” type in both critical and general category, I renamed the critical one to “food source critical”. And Since the violation type’s names are too descriptive, I later assigned a violation type code to them.
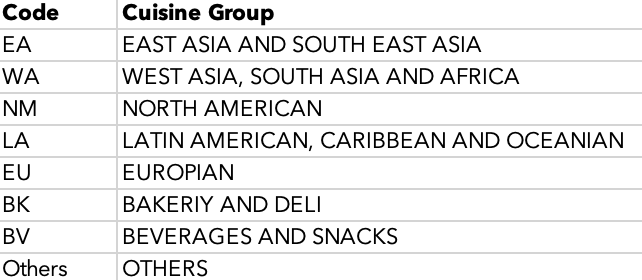
One other grouping column is the cuisine type groups. As stated before, the original DOHMH dataset has 85 different cuisine types, but the hierarchy of these types are not consistent and sometimes they are sometimes overlapping. Although there are no official guidance of this grouping, which made this process subjective and causes information lost, I decided to group them to absorb the ambiguity. After some card sourcing process, I’ve categorized the restaurants into 8 groups:

1. East Asia and South East Asia food (EA): These kinds of food have a similar origin, and in NYC, the boundary of these restaurants are usually blurred;
2. West Asia, South Asia, and Africa (WA): Except Ethiopian, most of the African countries in the list are Muslim dominated countries, which gave them a similar food culture with West Asia. And compare with East/South East Asia, South Asia’s food culture is closer to West Asia (except that India is conservative);
3. North American (NM): Creole, Cajun food and Soul Food are all southern cuisines;
4. Latin American (LA), Caribbean and Oceanian: I combined Oceanian food (except Australian) here for that Oceania has only three values;
5. European (EU): After some research, Australian food is usually not Maori food but European style;
6. Bakery and Deli (BK): Include all pre-made food, bread, and food would usually sell in a Deli such as salads or sandwiches;
7. Beverages and Snacks (BV): Drinks and non-dish food;
8. Others: Uncategorized items;
The detail of the grouping is attached as Appendix 7.
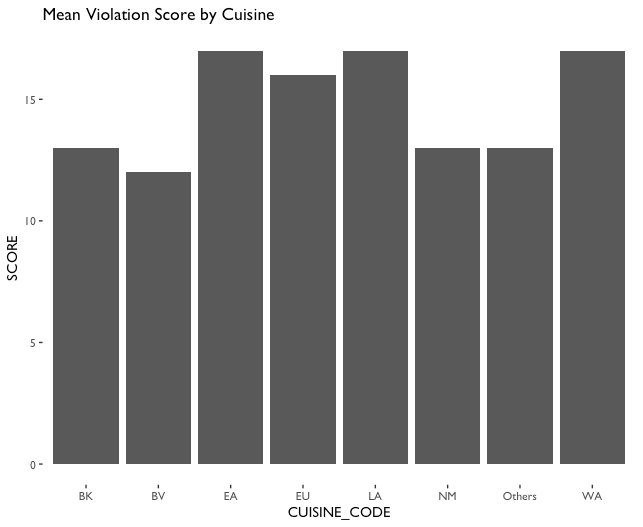

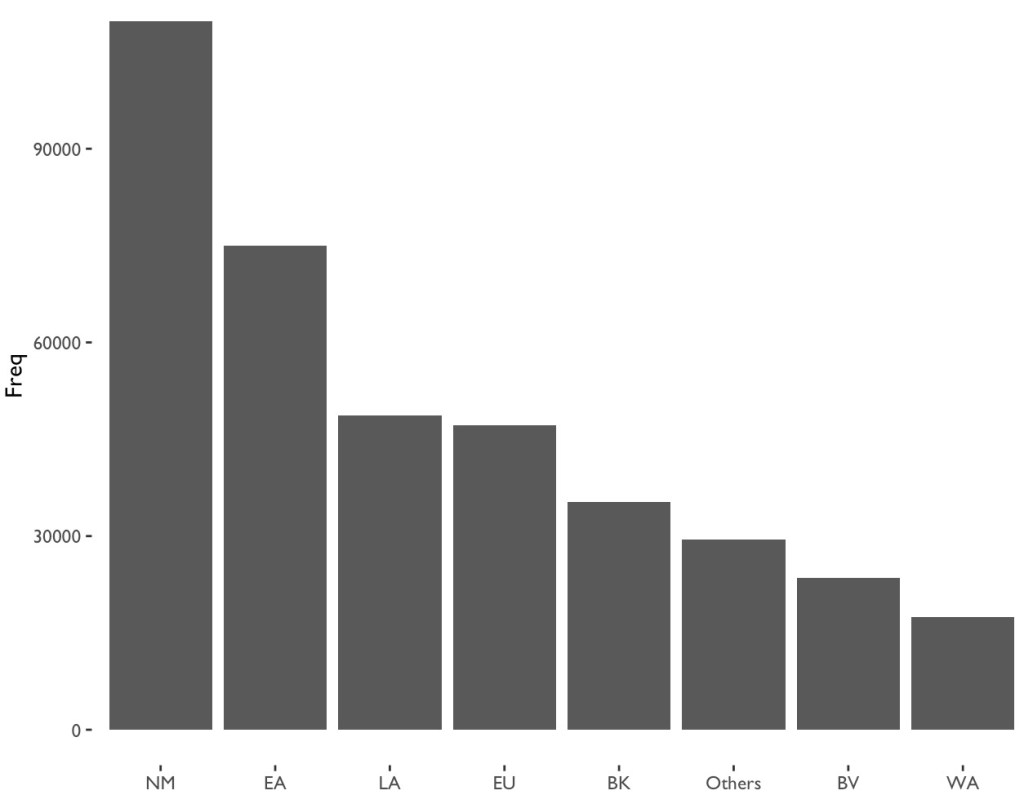
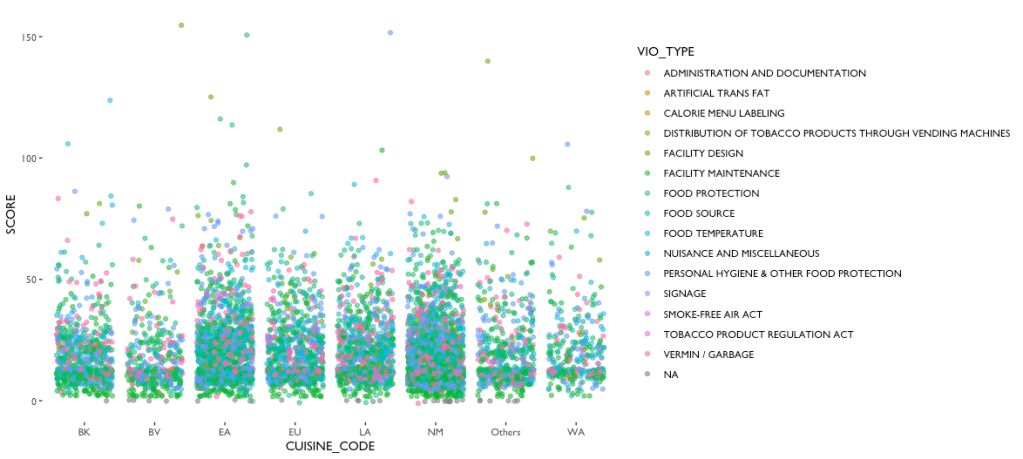
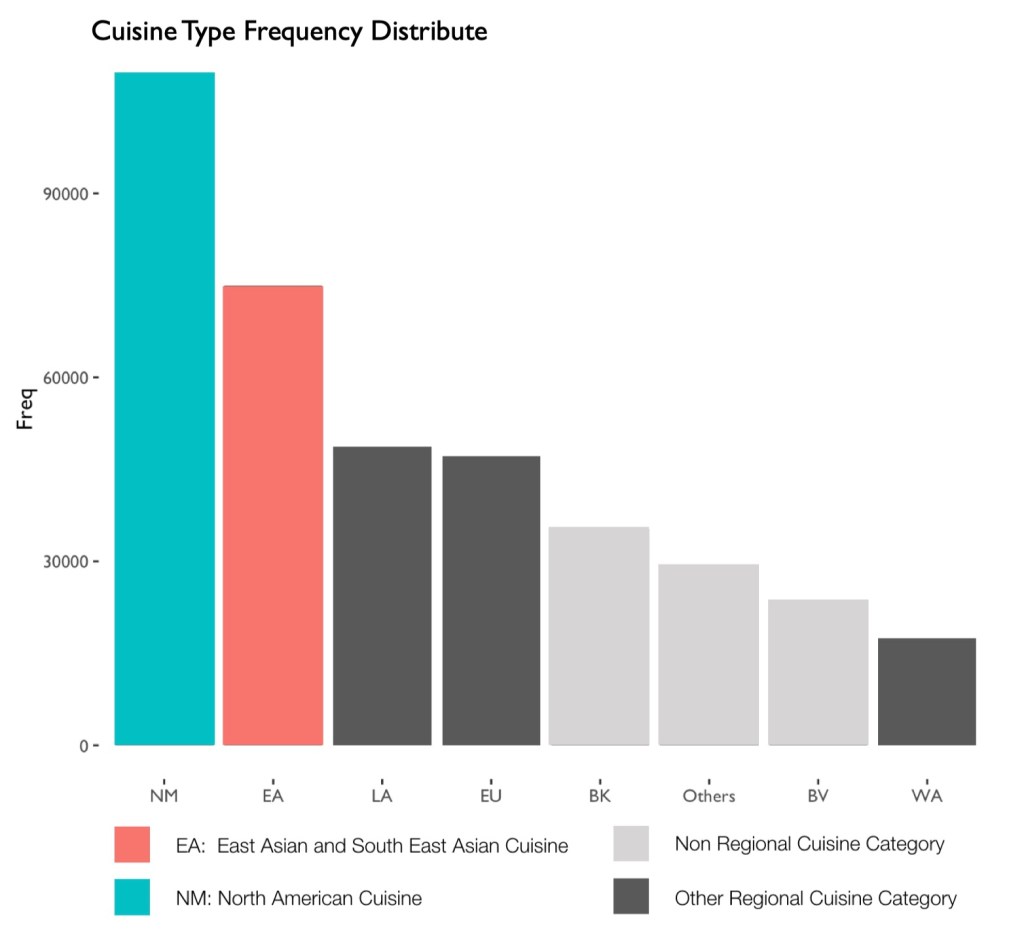
The last manipulation I did was to group the dates by month. Since the DOHMH is not inspecting the restaurants everyday, it would be more meaningful to calculate the average score of each cuisine time in every month. These groups made it possible to generate meaningful visualizations of the dataset. Since I was hoping the dataset tells me whether there’s a difference of the sanitary performance varies across different cuisines, and the score is the most direct value that determines the performance, I made plot of scores and cuisine types (see fig.3). Similar to fig.1, I made a scatter plot to show the performance of each cuisine type, but selected only a sample of 8000 observations to avoid too much overlapping. The plot shows that EA (East Asia and South East Asia Cuisines), LA (Latino and Caribbean Cuisines) and NM (North American Cuisines) has more records and the distribution of their scoring is wider, but it didn’t tell much about the performance of each cuisine type. In order to see the trend of scoring clearer, I made two bar chart to show the mean and median value (see fig.4), and it is clearly showing that WA (West Asia and North African Cuisine), LA, and EA are considerably higher than other cuisine types. On the contrary, the only regional type that has a lower value is NM. On the other hand, NM and EA are the most frequent cuisine type in the documented restaurants in New York (see fig.5). Therefore, if we want to avoid noises as shown in fig.6, the best way to narrow the dataset down is to compare just EA and NM.
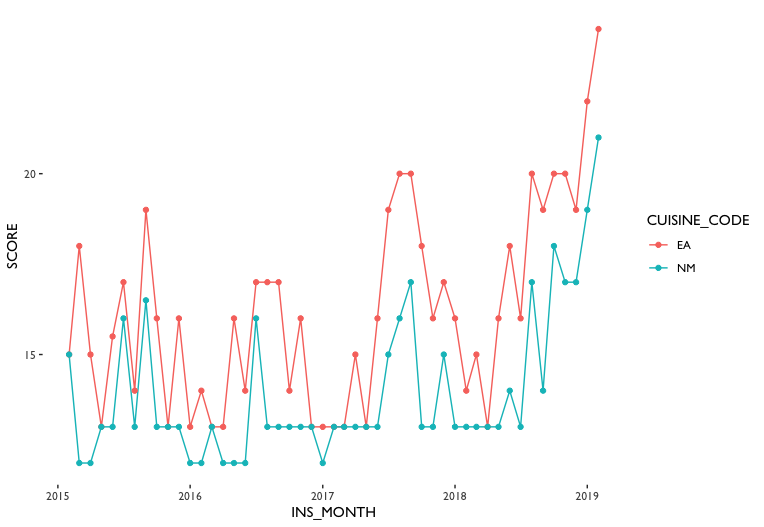
That leads to my last manipulating decision that analyze only EA and NM cuisines. This will help subsetting will help us understand why NM types of cuisine has generally lower inspection score than other cuisine types without too much complexity. In the fig.6, it can be observed that Asian restaurants have a generally higher score (which is bad, a higher score means more or more critical violations) than American restaurants and that the trends are similar – they basically go up and end at the same point. It can also be seen that there are some peaks at the beginning of 2019, the mid-2017, and the mid-2015. There might be some change of inspection rules or simply a new inspection team/leader has kicked in.
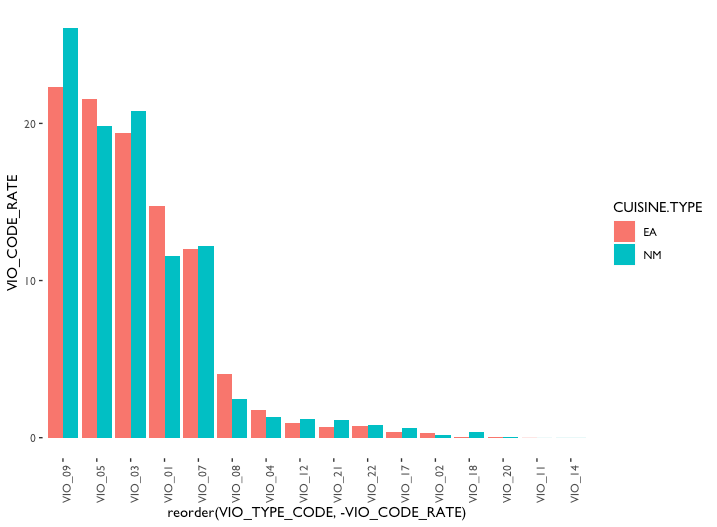
Unexpectedly, the violation rate chart shows a different story – NM types of cuisine has a higher rate in many violation types. I later realized that it is because different violation code has a different score value. The alternative figure in the Observation section (fig. 13) actually makes more sense in cooperating with fig.6. Note that the smaller violation type code represents a more serious violation, and EA types of cuisines got a worse score than NM types of cuisines in these critical violations.
With the understanding of this, it would be meaningful to introduce the decision tree algorithm into the analysis of this dataset, in order to find out whether DOHMH has a bias in scoring. I planned to use the NM type of cuisine as a training dataset and see if the result of running this upon EA type of cuisine meets the actual situation. If not, there might be a bias occurred in DOHMH scoring system. Since some of the violation types are not occurred in both EA and NM types of cuisines, I can’t directly use the original table. Alternatively, I created a binary matrix to indicate each VIO_TYPE, 1 represents being recorded, and 0 is not. Additionally, I utilized borough (BOROUGH) and critical type (CRITICAL_TYPE) as extra independent variables. The seed was set to 1000, and in order to create a more interpretable tree, the cp parameter was set to 0.0005.
OBSERVATION
During the research on the DOHMH dataset, many plots and charts were generated. Some of them tell rich stories.
This section will mainly showcase these graphs and explain each graph’s Fig.8. Cuisine Code Dictionary, see meaning. In order to parse the Appendix 7 for more details. visualizations, the first thing I need to address is the cuisine type codes (CUISINE_CODE, see fig.8) and violation type codes (VIO_TYPE_CODE, see fig.9) that I have assigned. As being mentioned in the method section, the Cuisine Groups are based on a card sourcing process, and the I assigned codes to keep the labels on visualization concise. For the same reason, I also assigned codes for the violation types. Note that this VIO_TYPE_CODE is different from the VIO_CODE from the original dataset.
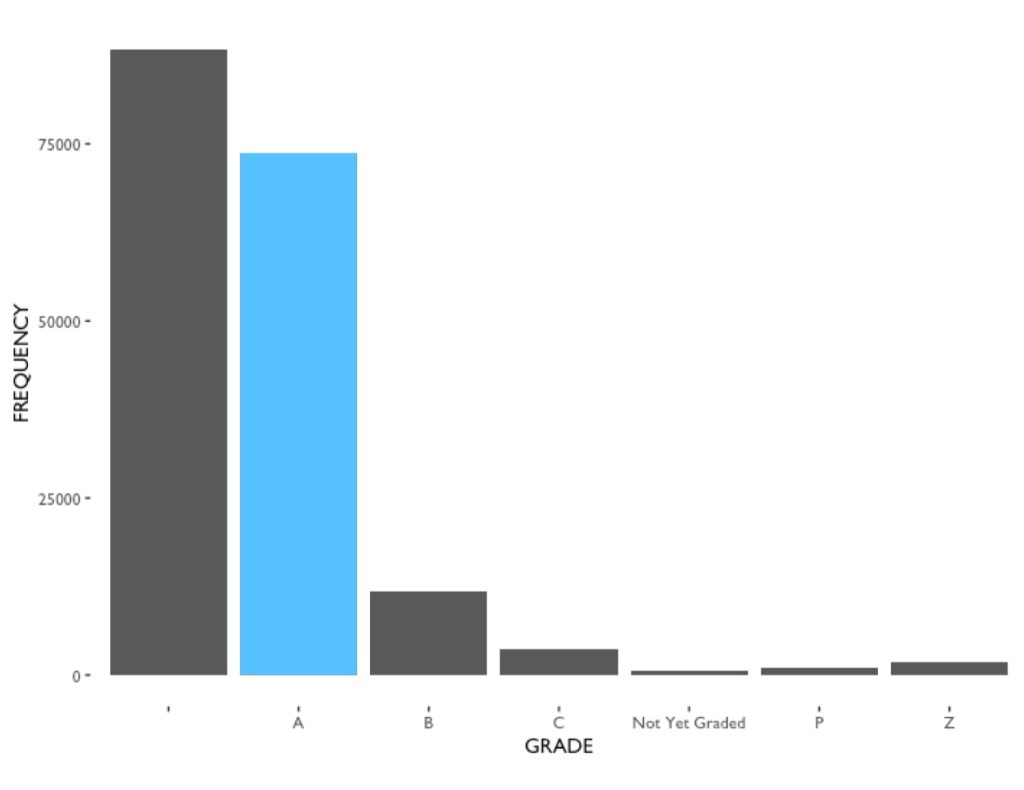
At an early stage of the research, a bar chart similar to the left one (fig.8) has been created. It shows the frequency of each letter grade in among all restaurant inspection citations (Feb 2015 to Feb 2019). According to DOHMH, letter A indicates the restaurant has been scored 0-13 in the last inspection, and those received letter B is scored 14-27 and those with 28 or more receive a letter C. (DOHMH, How We Score and Grade) P & Z both indicates “grade pending”, but P specifically indicates “Grade Pending issued on re-opening following an initial inspection that resulted in a closure” (see Appendix 3). From this chart, it can be seen that Grade A is much more than the other letters. It is because the letter grade system is not a tool to categorize restaurants but a system that triggers restaurants to perform better in compliance of food safety rules. As DOHMH has propagandized, “[e]very restaurant can achieve an A” (DOHMH, Practicing A-Grade Food Safety). Both B and C grade will result a reinspection. On the other hand, the largest portion has an empty value in grade. Although there were no clear explanations about these missing values, we can assume that they are the same with “Not Yet Graded”. Further, the whole restaurant inspection is a dynamic progress, and the re-inspection happens all the time, this dataset just a “snapshot” of it. Therefore, it is understandable that there are this many missing values. What’s more, it is worth mentioning that for the same reason there are many restaurants (with the same CAMIS ID) are appearing repeatedly. Some restaurants have more than one records of different inspection dates, or different violation code spot in the same inspection.
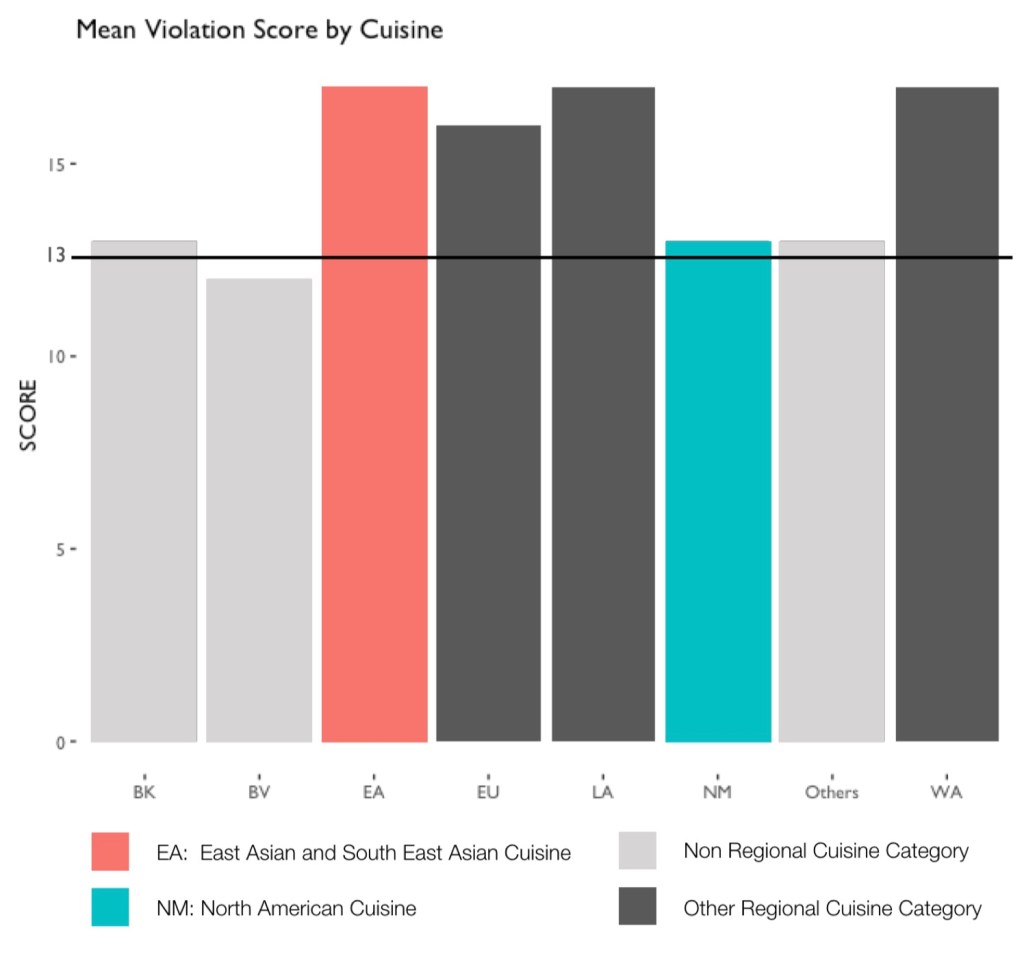
On the other hand, if we inspect the dataset by each cuisine type, we can find that there are some cuisine types have higher average scores than others (see fig.11). These cuisines are usually cuisine types categorized by region. The only exceptions is NM types of cuisines, on the contrary, EA, LA and WA cuisines have similar average scores and are also the highest average scores. On the other hand, there are no cuisine category has a crazily high average score. Most of them are floating around the hline (13), which indicates the highest score to receive an A grade. These cuisines are usually cuisine types categorized by region.

Further, as being stated in the former section, and in fig.12, NM also is the most common cuisine type in the New York city area, then the EA type of cuisine. Therefore, I decided to focus on only these two types of cuisine. As we already knew from fig.6, EA group has a relatively higher score than NM cuisines, and it is because different violation code has a different score value. The value is mainly determined by the seriousness (CRITICAL_TYPE), which gives a score range to each violation code (VIO_CODE), and being specified by “Condition” of violation (see Appendix 4, 5 for details). The “Condition” indicates the degree of each inspected violations, which is not recorded in the dataset, but an important parameter that influences the final scoring and grading. Therefore, it would be understandable why the trend showed in fig.6 doesn’t correlated to fig.7. To show the reason clearer, I removed the sorting parameter from fig.7 and generated fig.13. Although the violation “Condition” is not reflected in this chart, it can still be observed that EA restaurants performed worth in the critical violations (VIO_01 to VIO_05). The only critical violation that NM has surpassed EA is VIO_03 (food protection), which implies the food might exposed to contaminating sources such as employees carries bacterium, vermin, sewage, etc. Note that instead of showing the amount of violation, this chart is showing the percentage of each violation type among all violations, segregated by cuisine types.
Fig.6 and fig.13 told us a lot about the NM and EA restaurants, and showing that EA restaurants is generally performing worth than NM restaurants, which somehow meets my personal “surmise“. However, it would be credulous to satisfy with what DOHMH has told us. It is possible that the overall higher score of EA restaurants is caused by worse performance in compliance of city and state food safety rules, and it is also possible that the higher score is rated by biased inspectors. Given that, I trained a decision tree (fig.14) by NM restaurant data, and use that to predict EA restaurants’ value, see if the algorithm performs well.
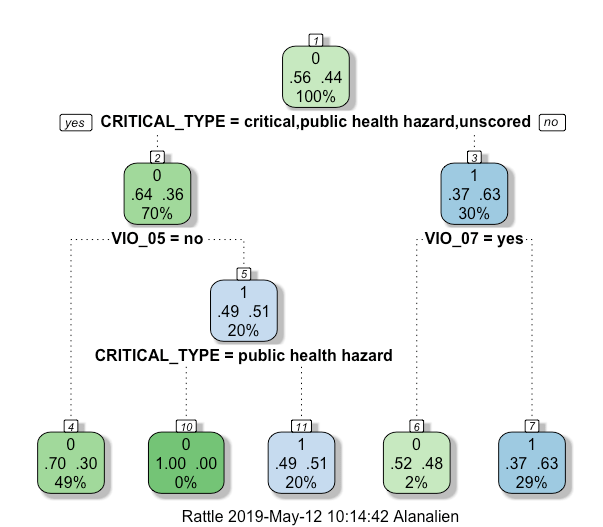
If we dig into the details of this decision tree, it can be found that the tree makes total sense – On the one hand, 30% of all NM restaurants didn’t violate any critical or public health hazard violations, and most of them achieved an A grade. Only 2% of all NM restaurants didn’t get an A when they performed well in not violating critical/public health hazard violations, and it was because they violated VIO_07, a general violation about vermin/garbage. On the other hand, 70% of NM restaurants has violated critical/ public health hazard violations. Within this group, 49% of all NM restaurants have violated is VIO_01 to VIO_04, which will cause a direct fail of achieving grade A. On the contrary, VIO_05 (personal hygiene & other food protection) is less influential, they can still achieve an A unless what they violated is marked Public Health Hazard”.
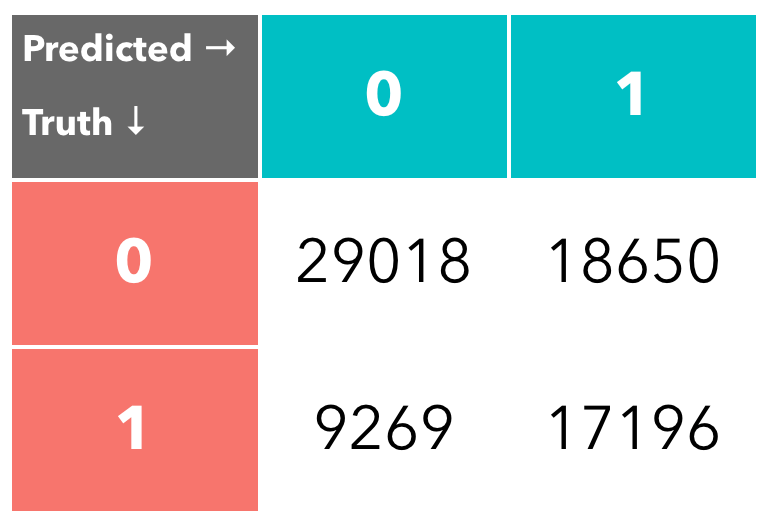
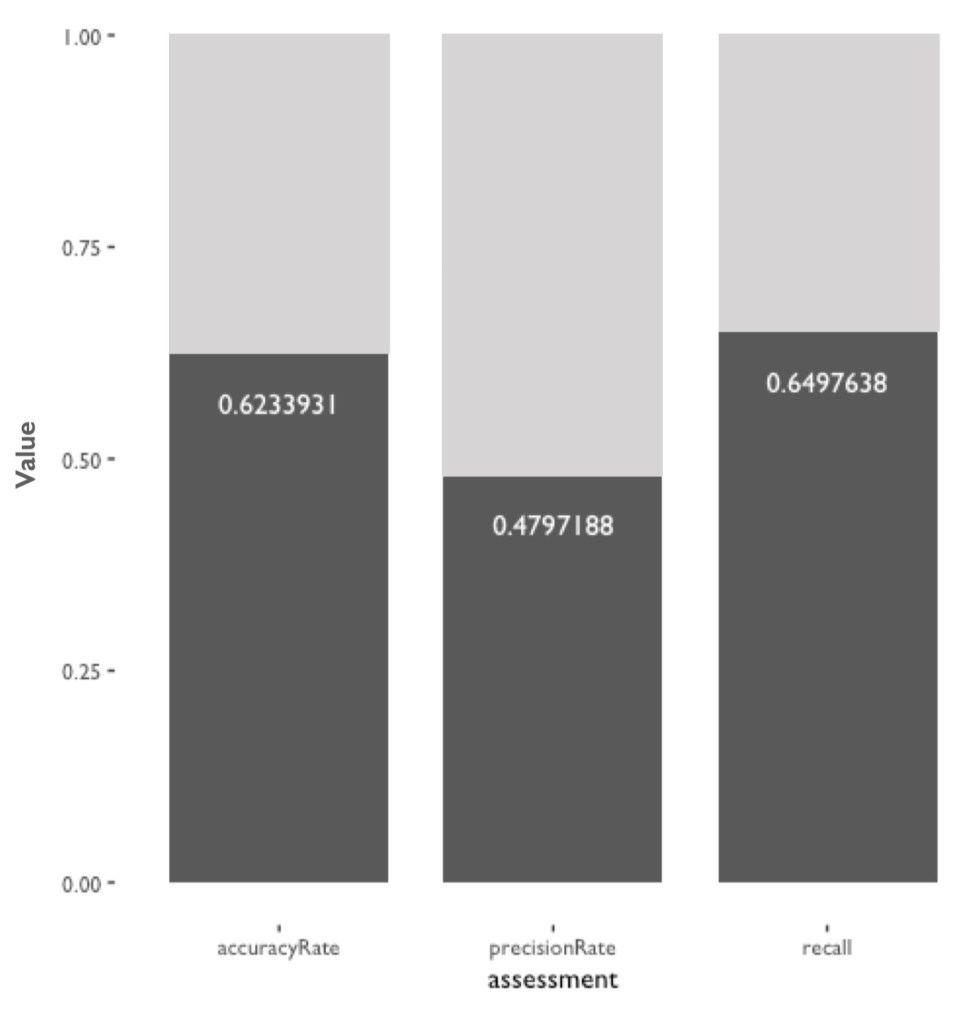
What can be interpreted here indicates that the decision tree reflects the DOHMH’s scoring matrix (Appendix 4) pretty well. Therefore we should assume it can predict EA restaurants accurately. However, the confusion matrix (fig.15) of the predicting result told a relatively different story. It is can be obviously seen that the false positive (FP) value is slightly higher than truth positive (TP) value. On the contrary, it predict the negative relatively accurate. The truth negative (TN) is much higher than false negative (FN). In order to see this result more statistically, I interpreted the matrix with three assessment methods, including the accuracy rate (TP + TN)/(TP+TN+FP+FN), the precisionRate TP/(TP+FP), and the Recall TP/(TP+FN). The result is shown left in fig.16. It is not hard to tell that the decision tree trained by NM restaurants is not necessarily accurate enough to be robust.
DISCUSSION
Before I started this research, I had an (inappropriate) assumption that Chinese restaurants and Latino restaurants usually have a relatively worse sanitary situation. This assumption is based on my stereotype, or bias. But then the DOHMH dataset proved my bias, which have two possibilities behind. One is that these restaurants are actually dirtier, while the other is the DOHMH restaurant inspection system is also biased. It can be the inspection method is biased, or the inspectors are biased. Based on the decision tree testing, I could not affirm that the bias is the only reason that caused that EA restaurants have the overall higher inspection scores, but I would argue that bias exists.
Despite that multiple reasons (eg. the violation “Condition” is not included in the dataset) causes the inaccuracy of the decision tree testing, and the three assessment method indicates the decision tree trained by NM data is not robust, there is one aspect that the algorithm can predict with more accuracy. Although precision rate, which indicates the “how useful the search results are”, is a correlation, it does indicates how precise the model can predict the positive results. In this case, with a precision less than 0.5 indicates that the model is not really useful. However, if we take a step back and calculate TN/(TN+FN), and get the precision rate of the negative values, the result become 0.7579074. This rate indicates that the tree can predict negatives (not graded A) much more accurately. The difference between the positives and negative precision rates, in my opinion, suggests that the DOHMH might have a bias when inspecting NM and EA restaurants.
On the other hand, as being stated, this suggestion is based on the absence of Violation Conditions. Considering the Violation Condition actually influences the inspection score significantly (see Appendix 4), it would be valuable to be included in this research which is based on the DOHMH’s inspection grade, for the reason that it is not included in the DOHMH data. The restaurant inspection score is given based on five degrees of each violation code, and if we look into the inspection score table, it is not hard to find that all of the violations marked “public health hazard” has a condition V (5) option, and only rare of the other violation can be checked condition 5. What’s more, the letter grading is also based on the condition score values. The smallest number (condition 1) of violating “public health hazard” violations is 7, violating any two of these violations will directly receive a letter B; and violating any one of those violations with condition 5 will directly result in a grade C (scored 28+) or closing down. Given that the violation condition is so significant, the way that DOHMH defines the condition is practical but might be arbitrary (see Appendix 5). For instance, for violation code 2B (critical and public health hazard), the way the condition being verified is how many food items were observed holding out of the proper temperature (140°F). Although it looks like a subjective observation, the actual condition of inspecting can be less ideal and causes biases.
It is also arguable that this inspection system is based on an American standard of food sanitary quality, suggesting that maybe “other” kinds of cuisines are easier to perform worse in this inspection. In addition, one of my classmates, Nathaniel Quinn, has suggested that the restaurant cooperations such as the chain restaurants like the MacDonalds, who has a much better stuff training, can also create a bias of the inspection results. I would also argue that these kind of trainings on some stages are mostly focusing on “how to avoid” violation, instead of actually provide a cleaner dining environment. Therefore, it is skeptical that the the inspection results become less accurate when more powerful the restaurant cooperations are, and this can also result as some kind of biases.
Lastly, as mentioned before, the DOHMH restaurant inspection dataset is frequently updated, and is a dynamic process. This whole research is based on a snapshot of this process. On the one hand, this snapshot allows me to take a peek into the system and understand the basic methodology it applies. On the other hand, this snapshot can hardly reflect the full image of how restaurants were scored and graded historically. The difference between fig.2 and fig.6 reflects this suspicion, that some of the early inspecting results are either deleted or archived and not included in the open dataset. However, as fig.6 has suggested, that the DOHMH did not follow a consistent standard when conducting the inspection, otherwise the two lines of different cuisines won’t paralleled that neatly, which also suggests a possibility of the existence of biases.
All of these are not suggesting that the Restaurant Inspection system is bad and inappropriate, but that bias is so normal and unavoidable in our life. As Mellissa Wong has suggested that the food sanitary condition in New York City has actually improved with the letter grading system and unannounced inspection (Wong, et al.), the system is actually built to trigger an improvement of the food sanitary condition, instead of categorize the restaurant into different sanitary levels, and that is also the reason why DOHMH propagandize the “every restaurant can achieve an A”. The bias existing or not in this system does not significantly harm the basic function of this system, but avoiding bias can definitely help DOHMH understand the situation better. Therefore, further researches with the complete historical data and detailed citations of violation conditions is valuable and should be able to provide a clearer indicator of whether the bias exists and its causation.
REFERENCE
Bulletproof Food Safety. Frequently Asked questions about doh inspections and tribunal hearings. retrieved on Apr 28, 2019.
DOHMH. How We Score and Grade, Food Establishment Inspections. retrieved on May 11, 2019.
DOHMH. Practicing A-Grade Food Safety. retrieved on May 11, 2019
DOHMH. What to Expect When You’re Inspected: A Guide for Food Service Operators. retrieved on Apr 28, 2019.
Melissa R. Wong, Wendy McKelvey, Kazuhiko Ito, Corinne Schiff, J. Bryan Jacobson, and Daniel Kass. 2015: Impact of a Letter-Grade Program on Restaurant Sanitary Conditions and Diner Behavior in New York City, American Journal of Public Health vol.105, e81_e87, May 7, 2019.
APPENDIX
Appendix 1. DOHMH New York City Restaurant Inspection Results
* This zip file includes data in csv format that based on the Feburary fraction of DOHMH inspection data. As mentioned in my research, this data is in a dynamic process, so it won’t be reaccessable from NYC Open Data.
Appendix 2. About Restaurant Inspection Data from NYC Open Data
Appendix 3. Restaurant Inspection Data Dictionary
Appendix 4. DOHMH: Self-Inspection Worksheet for Food Service Establishments
Appendix 5. DOHMH: Food Service Establishment Inspection Scoring Parameters: a Guide to Conditions
Appendix 6. DOHMH: Food Service Establishment and Non-retail Food Service Establishment Penalty Schedule
Appendix 7. Restaurant Categorize Table
*In the original dataset, the categorize of “CUISINE.DESCRIPTION” column is messy and overlapping. In order to absorb these messiness, I grouped them by these cuisine’s type. This table is created in Excel and transposed in OpenRefine.
Appendix 8. The R Code that Being Used to Conduct this Research
The R code included is rough, uncleaned but bug-less. Three CSV files will be required when running the code, which are Appendix 1, Appendix 6b, and Appendix 7b (csv format of Appendix 6 & 7). Libraries ggthemes, tidyverse, dplyr, lubridate, tidyr, tidyverse, rpart, rpart.plot, rattle, RColorBrewer, class, and factoextra need to be installed before running the code.
