
This project is done as a practice of ArcGIS, in Prof.Christensen’s Intro to GIS course, and is based on the SpatialLab’s tutrial “Introduction to Spatial Data Uncertainty“, by Suzanne Perlitsh Wechsler. This tutorial guided me to walk through the usage of the analytics of “fuzzy boundaries”, which allow people to show uncertain boundaries in GIS and understand what happens in the fuzzy zone.
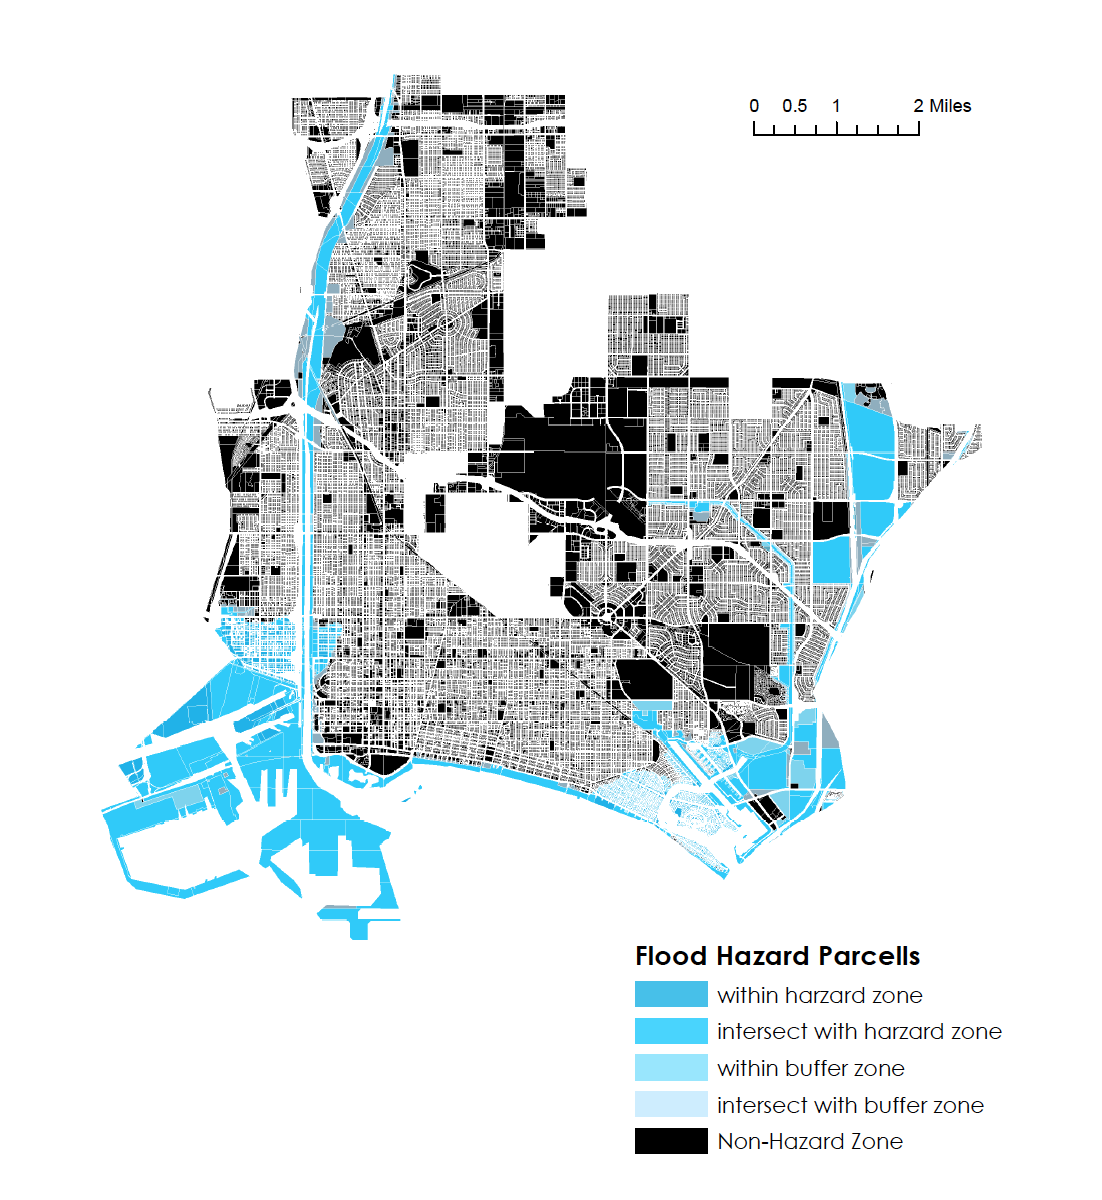
This project outcame two maps. The above one shows the flood hazard zones of Long Beach City and their fuzzy boundaries in 2017, while the bottom one shows whether the parcels were influenced, or possibly be influenced (intersect or within the fuzzy boundary).

The dataset is downloaded from Federal Emergency Management Agency (FEMA)’s website, and is derived from January 2017, and the shapefiles are National Flood Hazard Layer (NFHL) from FEMA and the County of Los Angeles through participation from Los Angeles Region Imagery Acquisition Consortium (LARIAC).
